Hierarchical cluster analysis of area and
length of foot and ankle ligaments
C Mkandawire, S.B., WR Ledoux, Ph.D., BJ Sangeorzan,
M.D., RP Ching, Ph.D.
RR&D Center of Excellence for Limb Loss Prevention
and Prosthetic Engineering, VA Puget Sound Health Care System
Objectives: A computational model of the
human foot and ankle has been developed by our research group to assist
in the treatment of diabetic foot ulcers. The model currently includes
51 ligaments, with each ligament modeled as a spring and dashpot in parallel.
Materials testing has been conducted on ankle ligaments (Funk 2000, Siegler
1988), but little work has been done on foot ligaments. Thus, mechanical
properties for the 51 modeled ligaments were extrapolated from Sieglerís
ankle ligament data (1988). We hypothesize that the mechanical properties
of a representative sample of ligaments, based on similar area and length
relationships, can be used to predict the properties of all ligaments
in our computational model. The purpose of this research was to identify
such groups for mechanical testing.
(Mkandawire)
Methods: Ligament geometry was obtained from
the right foot of the female specimen of the NIH Visible Human Project
(National Library of Medicine, Bethesda, MD). Digital image analysis software
(NIH Image, National Institutes of Health, Bethesda, MD) was used to identify
the three-dimensional cross-sectional area and length from the anatomical
image set. Resolution in the plane of each microtome was 0.33 mm, with
0.33 mm slice thickness. Thirty-nine of the 51 ligaments in our model
were clearly identified with distinct origins and insertions. A hierarchical
cluster analysis was performed using SPSS 7.5 (SPSS Inc., Chicago, IL)
to group ligaments based on their area and length.
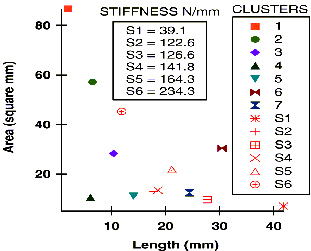
Results: Figure 1 shows seven clusters (1-7)
were generated from the cluster analysis. They were plotted as mean area
by mean length. Membership of each cluster was as follows, Cluster 1 had
1 member; cluster 2, 2; Cluster 3, 6; Cluster 4, 8; Cluster 5, 11; Cluster
6, 2; and Cluster 7, 9. Figure 1 also includes Sieglerís ligament data
(S1-S6) for comparison.

Conclusions: Sieglerís data demonstrates
that the stiffness of ligaments can be related to the area and length
ratio. Specifically, his data had three groupings of ligaments: S1, S2-S5
and S6. S1, with the smallest area and longest length, was the least stiff,
while S6, which had the largest area and smallest length, predictably
had the largest stiffness. The members of the last group had similar stiffness,
which, as expected, were values between S1 and S6. We have identified
a broader spectrum of ligament area and length ratios, and are currently
testing these ligaments to prove our hypothesis that ligament geometry
can be used to estimate mechanical properties.
References: Funk J.R., Hall G.W. (2000).
et al. J Biomech Eng. 122(1):15-22.
Siegler S., Block J., et al. (1988). Foot
& Ankle. 8(5):234-242.
Funding Acknowledgment: Supported by Rehabilitation
Research and Development Service, project number A0806C and the 2000-2001
VA Predoctoral Fellowship Award.
